Mobile App Survey Tool
Record attributes for all plants in a systematic monitoring program while automating tedious and error-prone data capture at scale.
Your crop data over time and space beautifully visualised.
Manage surveys, monitor trends across seasons, and keep your field teams and decision-makers aligned on one platform.
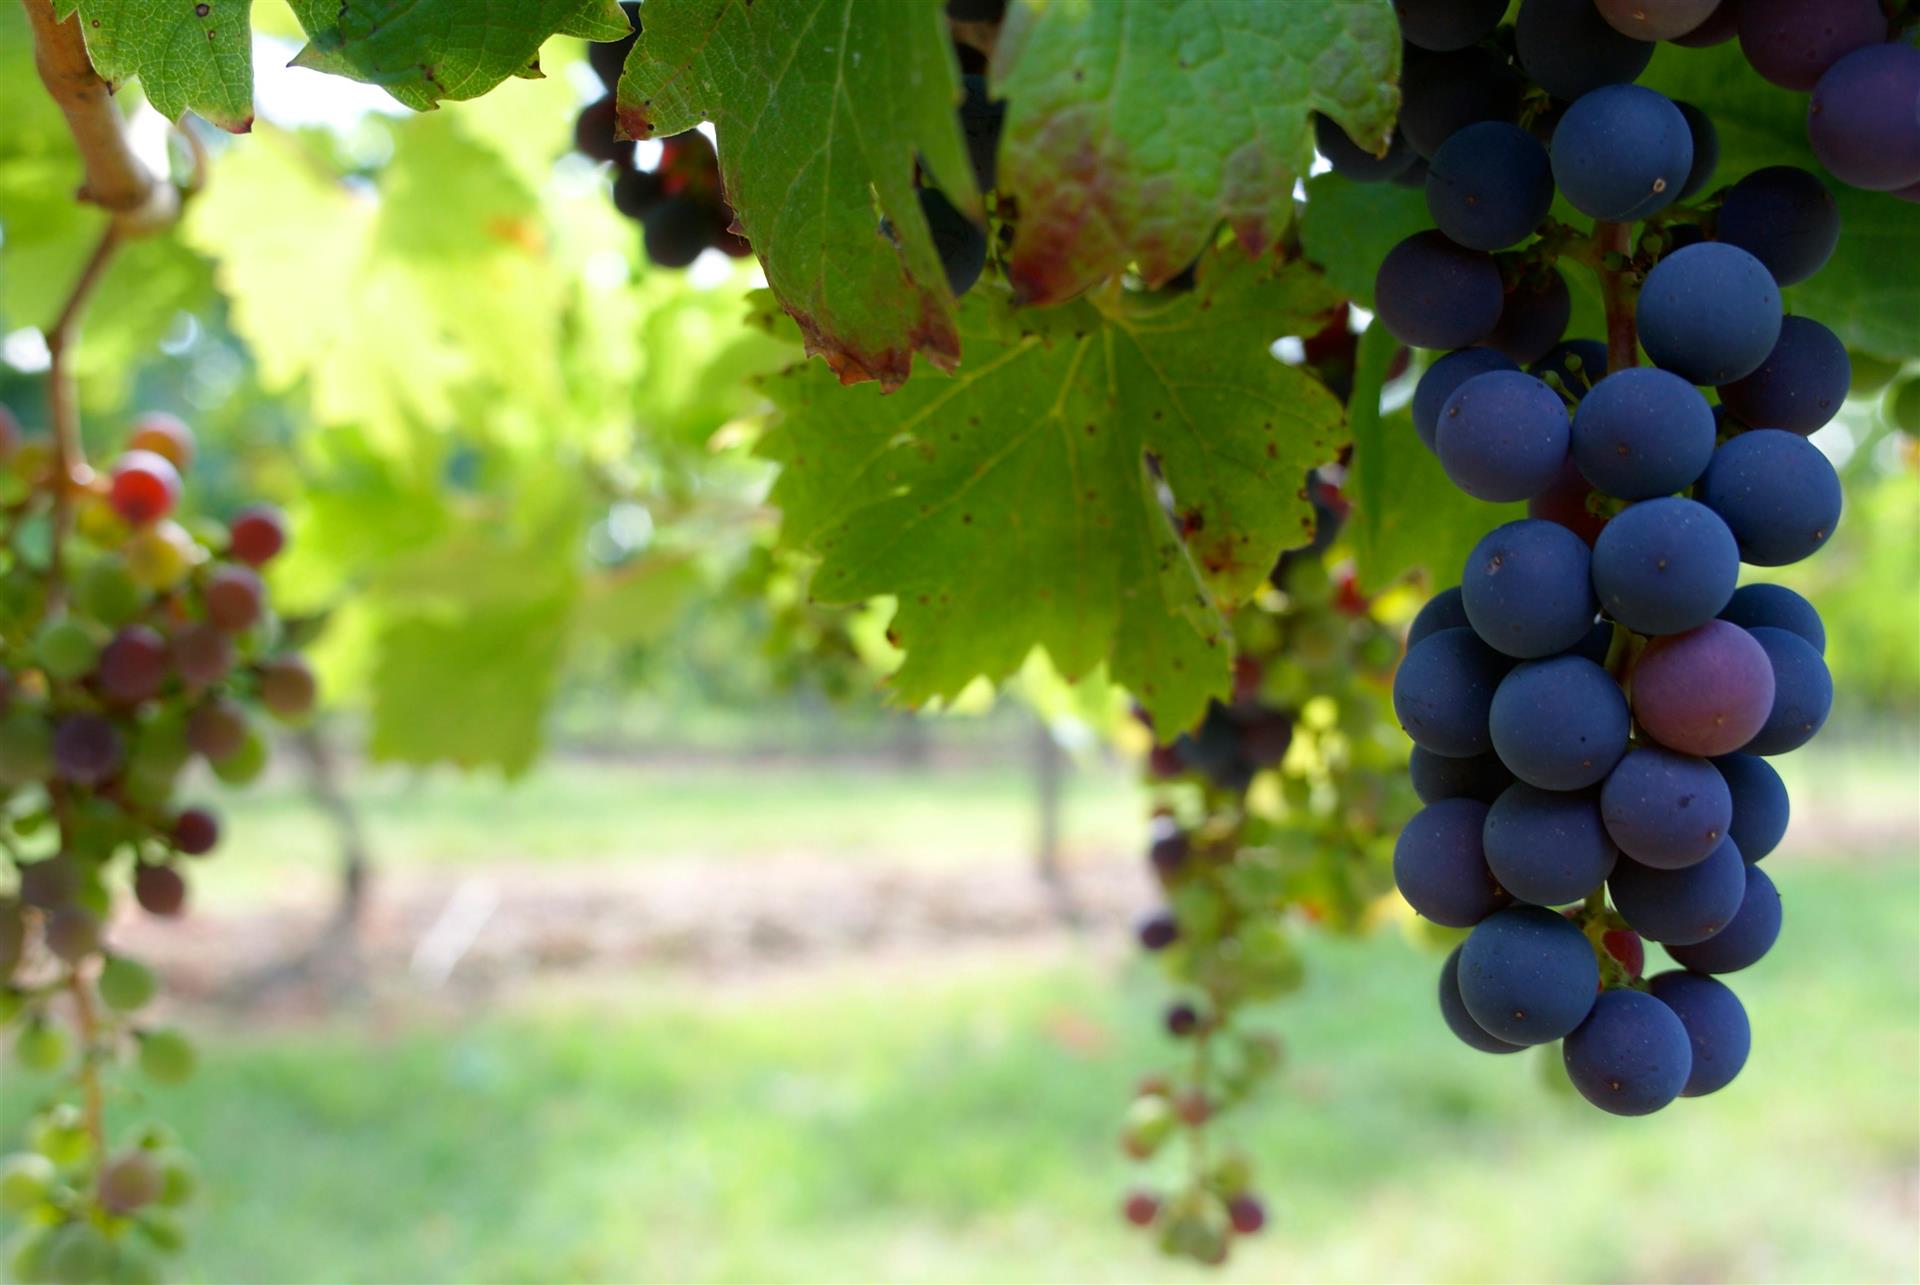

VineCloud is an information system developed for the management of agricultural programs. It bridges the gap between crops, field teams, and administrative decision-making. The platform supports grapevine surveillance at scale with a practical workflow from data capture to visual reporting.
The mobile app captures plant-level observations such as disease symptoms, empty positions, photos, and sample information. The VineCloud Dashboard processes this data into maps, statistics, and reports that help teams act faster and monitor trends over multiple scouting expeditions and seasons.
Mobile and web tools that simplify surveying, visualization, and reporting from block to farm level.
Record attributes for all plants in a systematic monitoring program while automating tedious and error-prone data capture at scale.
Quickly understand empty positions, infections, new plants and more with map and statistics views designed for fast decision making.
Transfer key observations and recommendations across teams with report generation and reliable storage for later reference.
Keep seasonal records from recurring observations and counts to surface trends and improve control strategies over time.
Start with VineCloud and bring your field and reporting workflows into one clean system.